Mean Height of 19-Year-Old Males, 1985–2019: Global Trends
In a quiet but measurable way, the world has changed vertically. Across nations and generations, the mean height of young men — an uncluttered, physical proxy for childhood health, nutrition, and living conditions — offers a window into social progress and persistent inequality. This article tracks approximate changes in the average stature of 19-year-old males between 1985 and 2019 for a selection of countries, unpacks the drivers behind those shifts, and explores what rising or stagnating heights tell us about health systems, economies, and human biology.
Why Height Matters
Height is often treated as a trivial physical trait, but for demographers, epidemiologists, and social scientists it is a compact summary of cumulative life experiences from conception through adolescence. Mean height at age 19 captures the end point of most adolescent linear growth and reflects prenatal nutrition, early childhood illness, adolescent diets, and the timing of puberty. Changes across decades usually point toward broad environmental improvements or setbacks rather than rapid genetic shifts.
Height is a social indicator: it encodes nutrition, healthcare access, and inequality across generations.
Data and Approach
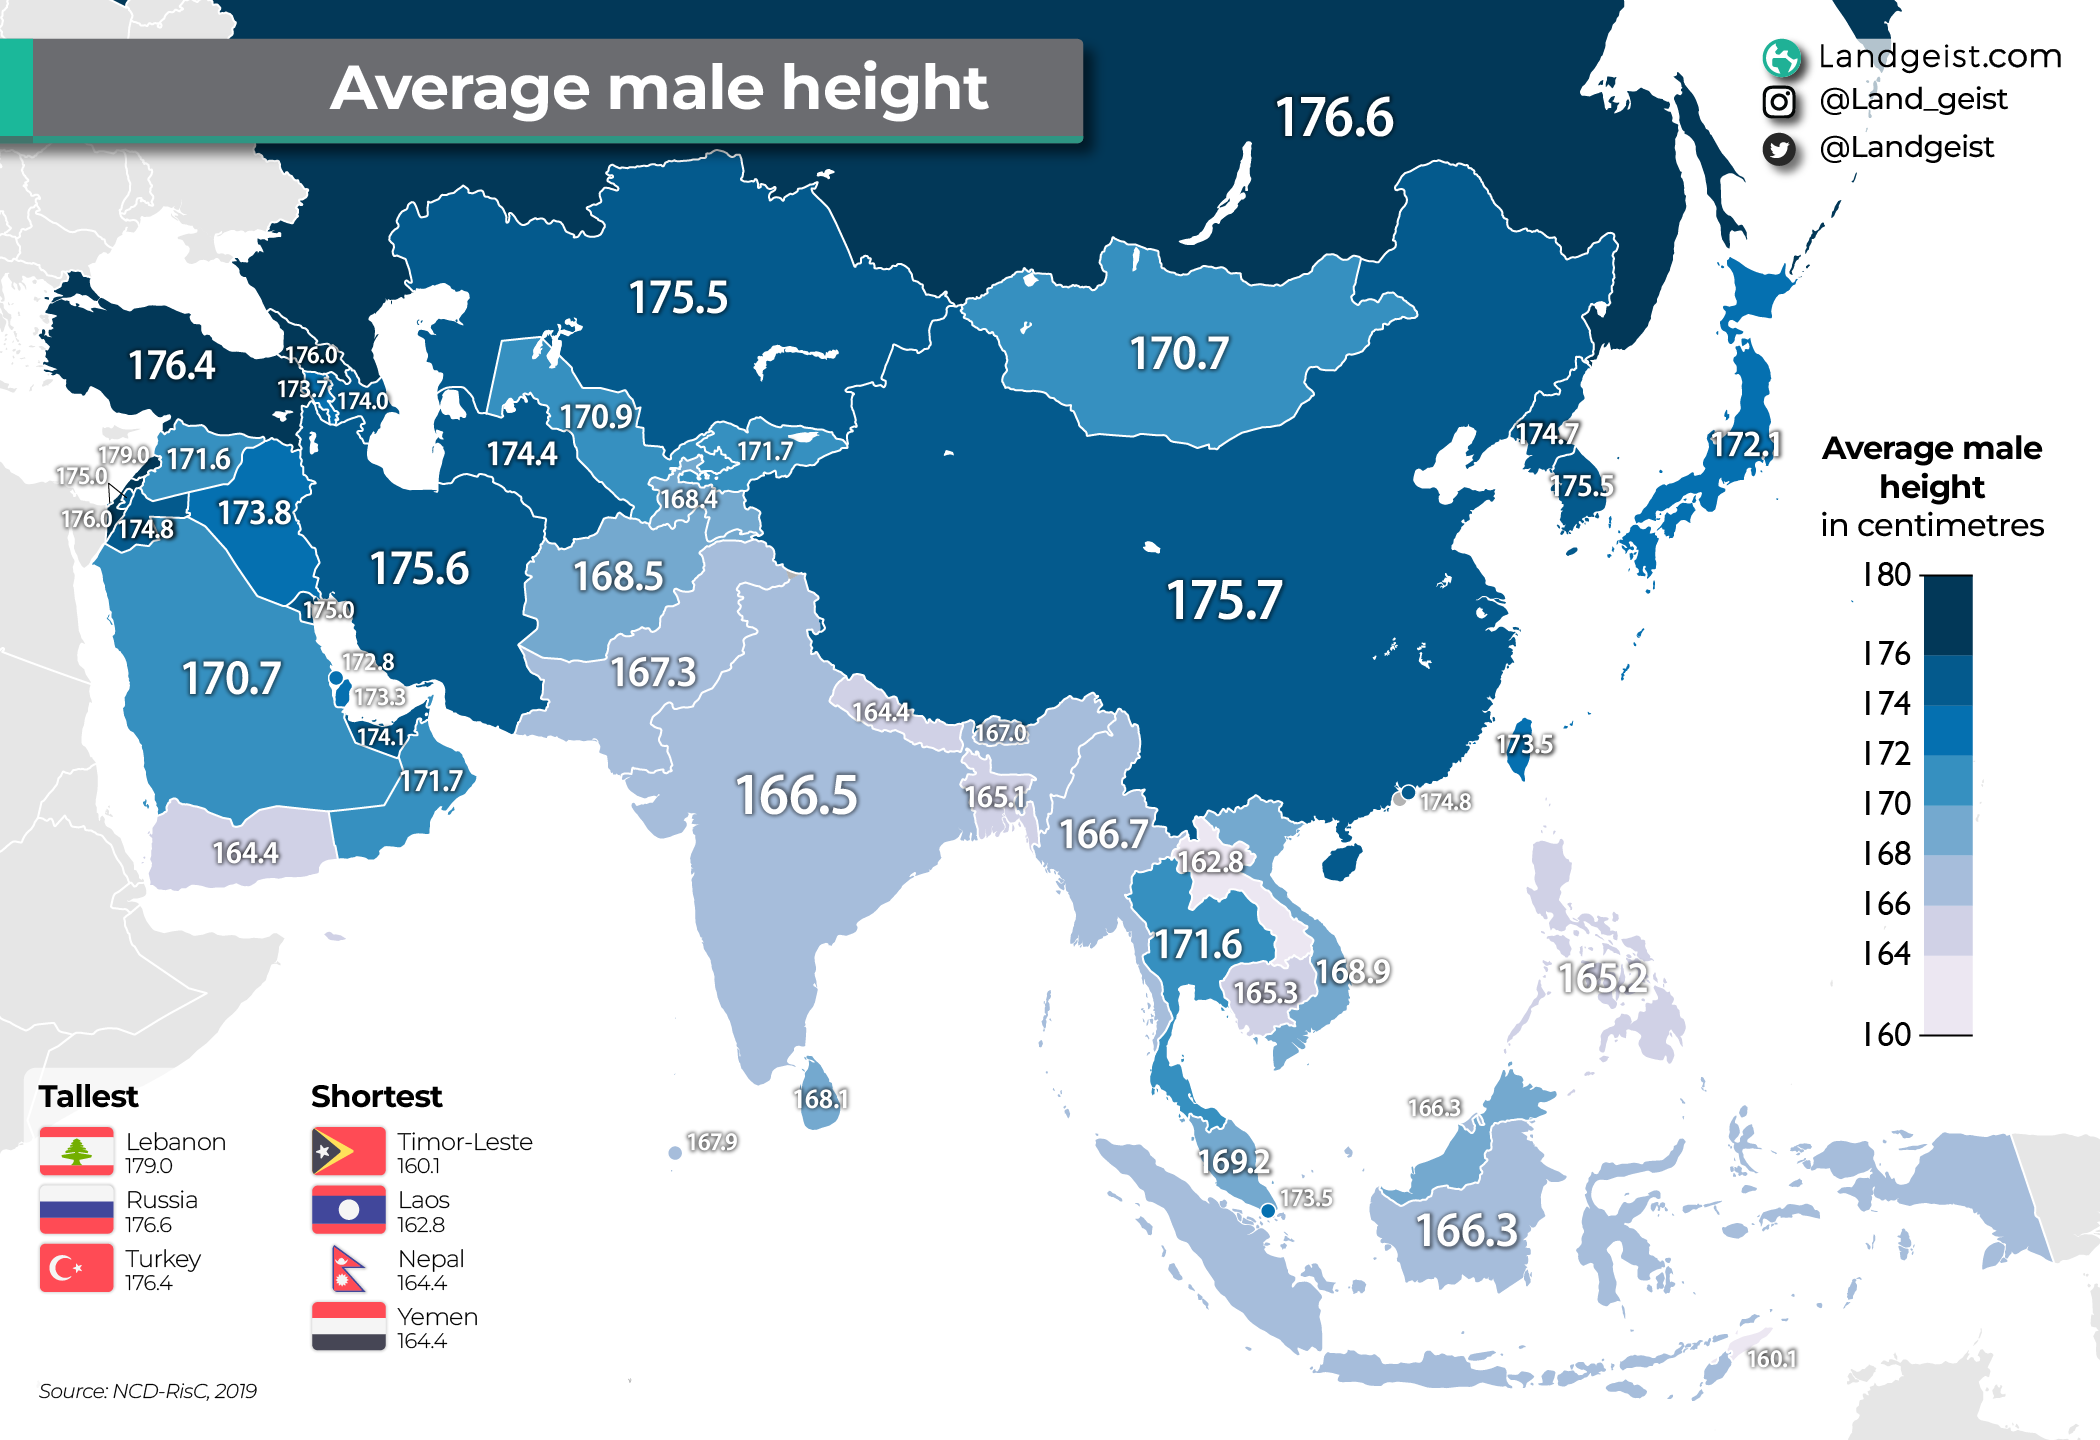
Because this is an interpretive feature rather than a strict dataset release, the numbers presented here are approximate indicators derived from established anthropometric studies and well-documented country-level trends. They are intended to show direction, scale, and comparative patterns rather than to substitute for primary-source databases. To make the patterns tangible, I highlight ten countries representing a range of geographies and development trajectories: the Netherlands, Germany, Russia, the United States, Japan, South Korea, China, India, Brazil, and Nigeria. For each I note approximate mean heights for 19-year-old males in 1985 and in 2019 and then discuss context.
Selected Country Table (Approximate Mean Height at Age 19, cm)
Below is a compact table to orient the reader. These figures are rounded, approximate averages intended to show relative change between 1985 and 2019.
| Country | Approx. Mean Height (cm), 1985 | Approx. Mean Height (cm), 2019 |
|---|---|---|
| Netherlands | 181 | 183 |
| Germany | 178 | 180 |
| Russia | 176 | 178 |
| United States | 176 | 177 |
| Japan | 169 | 171 |
| South Korea | 168 | 174 |
| China | 167 | 172 |
| India | 165 | 167 |
| Brazil | 170 | 173 |
| Nigeria | 169 | 170 |
Table: Approximate mean heights for 19-year-old males in select countries, 1985 vs. 2019.
Global Patterns and What They Reveal
At first glance, the table shows three broad patterns. First, high-income Northern European countries started high and rose modestly, often nearing a biological upper limit for the population. Second, East and Southeast Asian nations like South Korea and China display substantial gains, reflecting rapid improvements in nutrition and public health during their periods of economic catch-up. Third, countries with persistent socioeconomic challenges, such as India and parts of sub-Saharan Africa, show smaller increases or stagnation, indicating that gains in income have not uniformly translated into childhood growth.

Netherlands height 1985-2019
Northern Europe: Nearing a Ceiling
Countries like the Netherlands and Germany began the period already among the tallest. A small increase of a couple of centimeters does not mean these improvements are insignificant; rather, they suggest that once basic caloric sufficiency and low rates of childhood infection are achieved, further height gains slow and depend on finer-grained factors such as maternal health, adolescent dietary quality, and the incidence of childhood obesity, which can influence growth timing. For the Dutch, being among the tallest globally is a product of decades-long stability in nutrition and public health.
East Asia: Rapid Catch-Up
One of the most striking stories of the late 20th and early 21st centuries is the rapid rise in mean heights in parts of East Asia. South Korea's jump — roughly six centimeters in our table — is emblematic of dramatic improvements in childhood nutrition, healthcare access, sanitation, and socio-economic conditions between the 1960s and the 2010s. China shows similar but somewhat more gradual gains as urbanization and rising incomes lifted millions out of chronic undernutrition. Japan rose more modestly, because it started comparatively taller in the mid-1980s and had already reaped many gains from post-war improvements.
North America and Russia: Mixed Signals
The United States shows only slight gains across the period, a pattern shared with some other high-income countries. This stability masks internal inequality: mean height may hold steady while subpopulations experience gains and others do not. Russia and other post-Soviet states showed complex trajectories — a dip in growth during the tumultuous 1990s followed by recovery in the 2000s and 2010s. That interruption underscores how political economy and social disruption can directly impact child and adolescent health.

Russia post-Soviet height changes
South Asia and Sub-Saharan Africa: Slow Progress and Stagnation
India's modest gains through 2019 reflect a mixed picture: economic growth did not always translate into uniform improvements in child nutrition and sanitation. Large rural-urban divides, persistent poverty, and diversity across states mean national averages smooth over stark regional differences. Similarly, many countries in sub-Saharan Africa show slow increases or stagnation in mean height, constrained by repeated infections, food insecurity, and limited access to healthcare during critical early years.
Where growth falters, the causes are often structural: poverty, inequality, and weak public health systems.
Drivers Behind the Trends
Understanding why mean height changes requires an appreciation for timing. Height at 19 integrates conditions across the life course. Three broad categories explain most change: nutrition, disease burden (especially in early childhood), and socioeconomic environment — which includes education, sanitation, housing, and inequitable access to services.
South Korea adolescent growth
Nutrition and Food Security
Improved dietary diversity, increased protein and caloric availability, and reductions in early-life undernutrition are primary drivers of height increases. In countries that industrialized and urbanized rapidly, household incomes rose and access to varied diets improved, accelerating growth. However, rising caloric intake that lacks quality — for example, diets high in processed foods — can complicate the picture by increasing obesity even as linear growth slows.
Infectious Disease and Sanitation
Frequent childhood infections, including diarrheal disease and recurrent respiratory infections, impede nutrient absorption and increase energetic costs, suppressing linear growth. Clean water, vaccines, and antibiotics reduce these burdens. Large improvements in sanitation and public health can produce measurable height gains across cohorts.
India height stagnation
Socioeconomic Conditions and Inequality
Socioeconomic uplift — better maternal education, stable incomes, and reduced household crowding — produces more consistent childhood growth. Importantly, averages mask inequalities: two countries with the same mean height can have different distributions. A country with a large rich-poor gap may show a respectable national average while pockets of severe stunting persist.
Country Case Studies (Short Profiles)
The Netherlands
From an already tall baseline, Dutch young men saw modest increases. This stability reflects sustained public health, high standards of living, and egalitarian social policies that result in relatively uniform growth outcomes across socioeconomic groups.
South Korea
South Korea's rise is a paradigmatic example of how rapid economic development and mass improvements in living conditions can translate into biological gains within a few generations. From a lower starting point in the 1960s and 1970s, improved diets, widespread vaccination, and urban living conditions propelled steady increases in adolescent stature.
China
China's increase reflects large-scale economic and social transformation. Urban migration, better healthcare access, and rising incomes played leading roles. However, regional disparities remain, and rural children have historically lagged behind urban peers.
China mean male height 2019
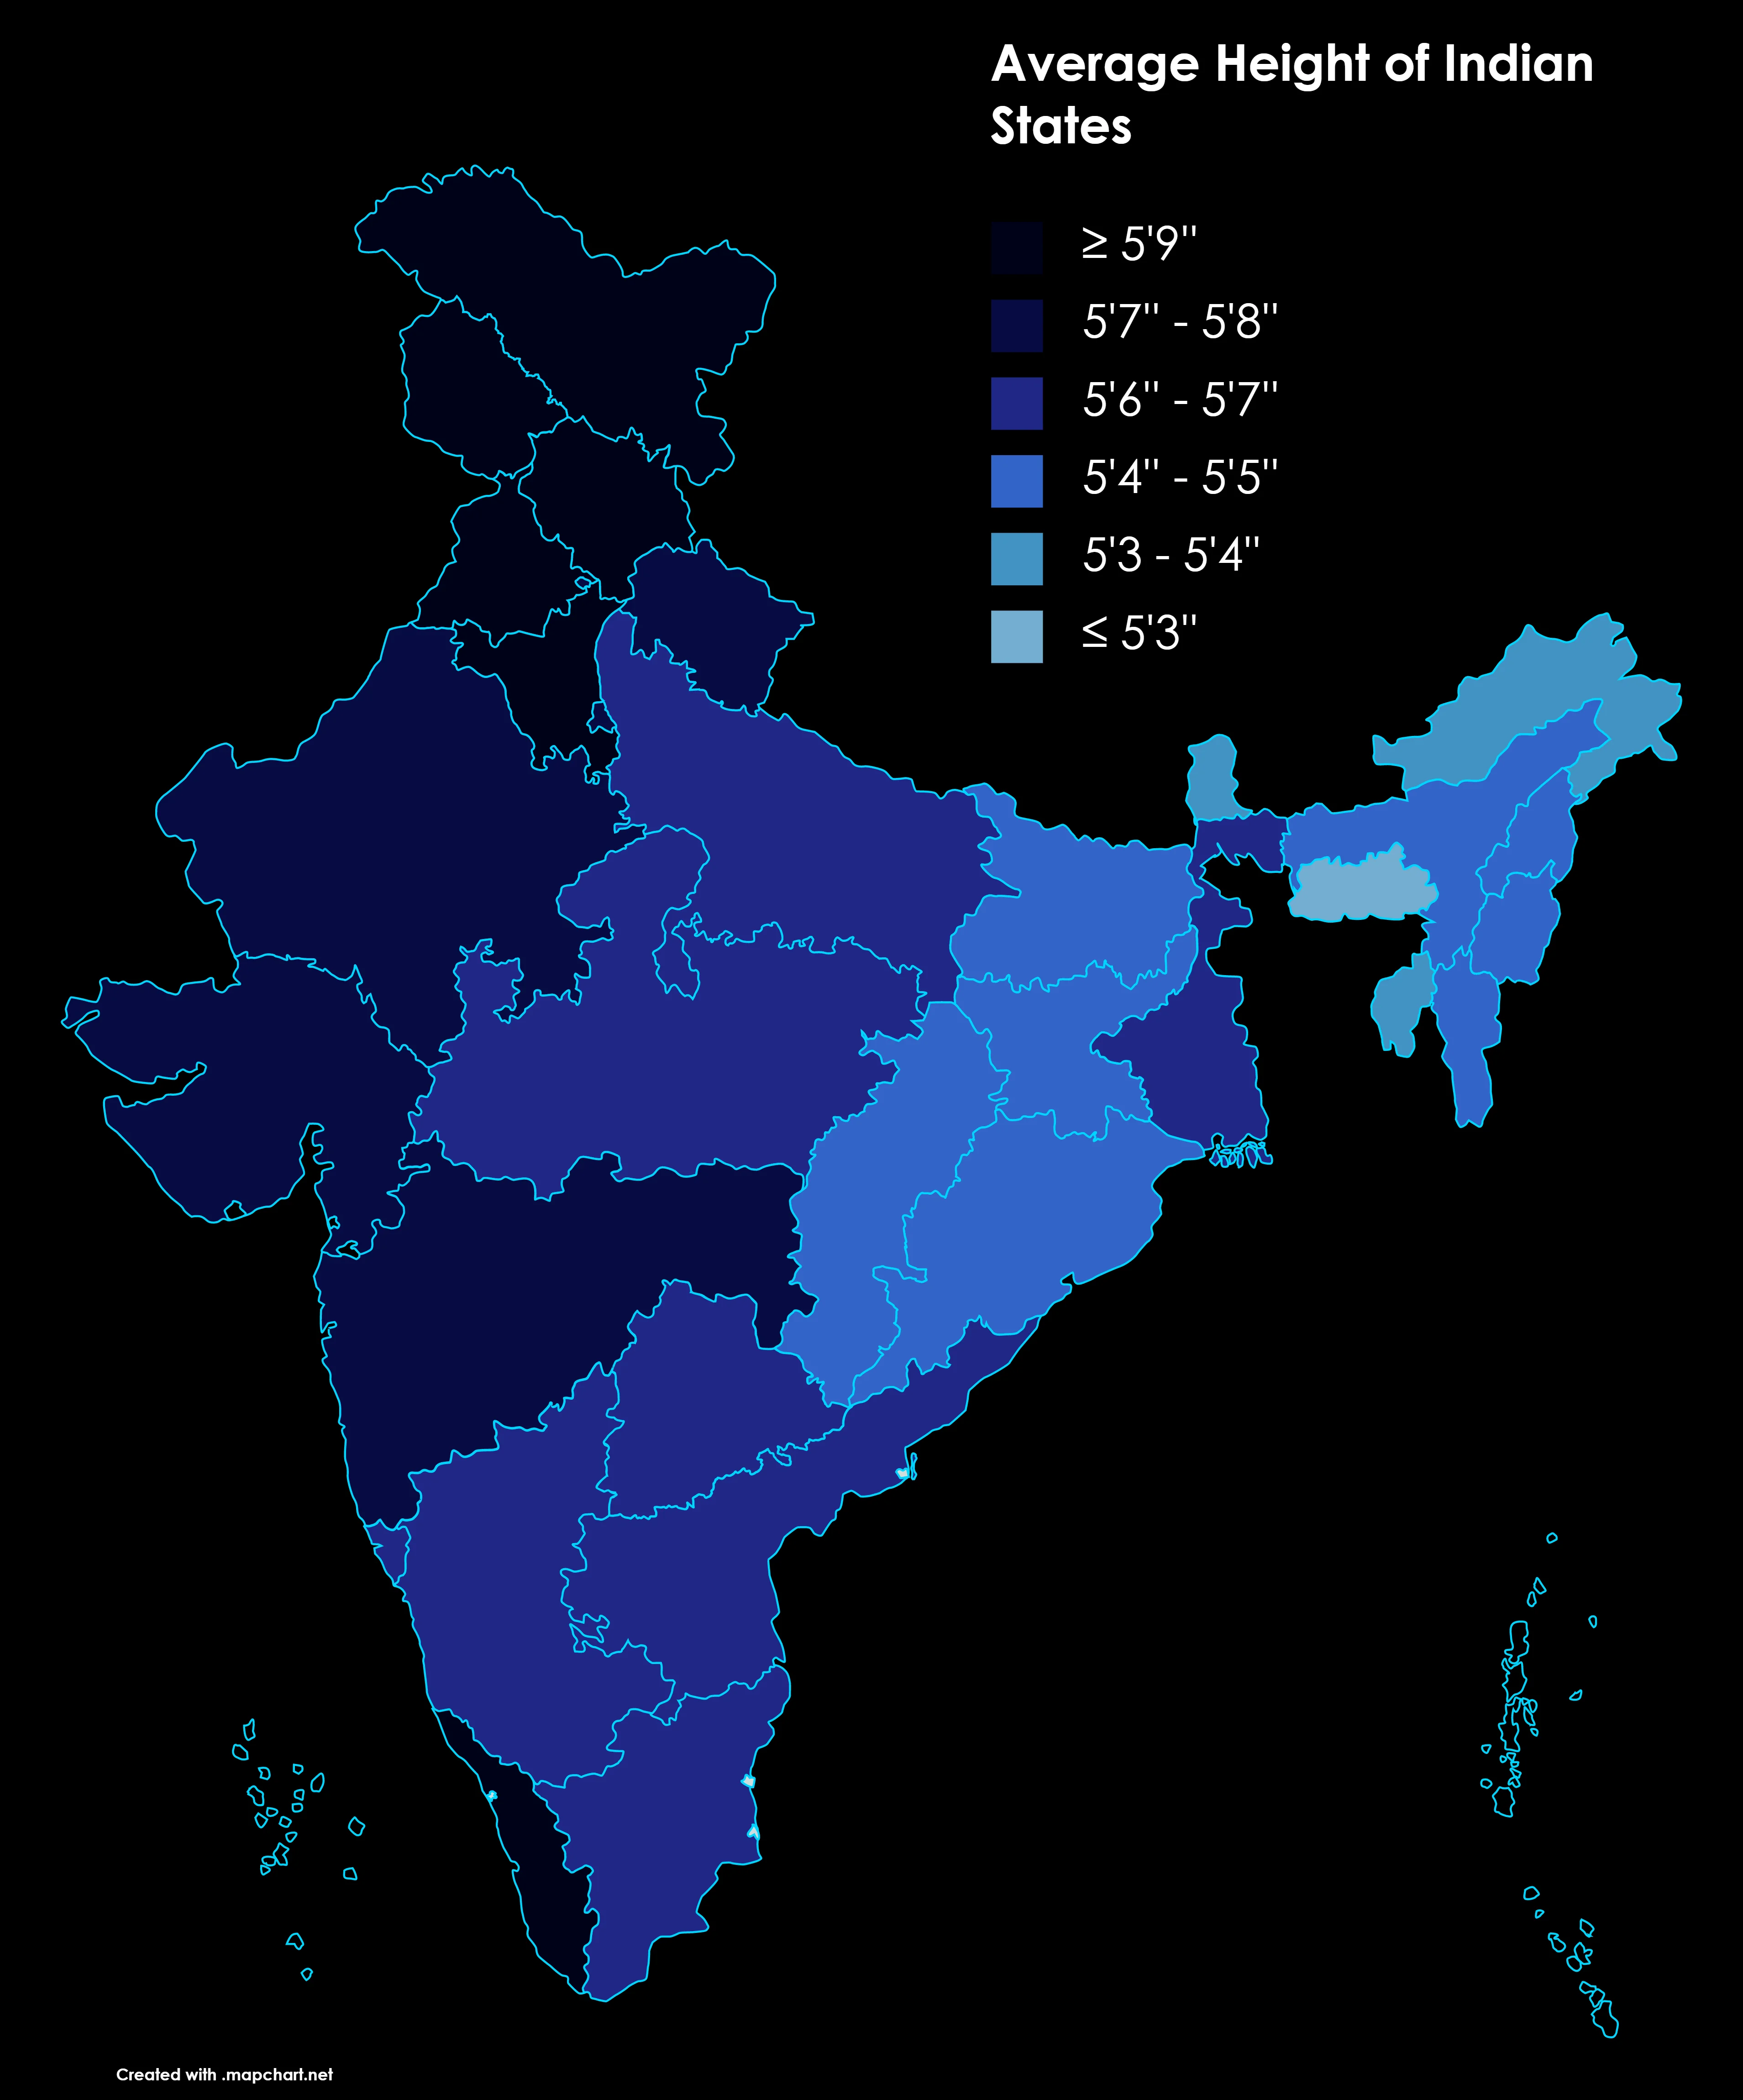
India
India's more modest gains remind us that economic growth alone is not enough. Persistent undernutrition, sanitation challenges, and uneven public services mean that many children do not receive the uninterrupted care needed for optimal growth.
United States
The U.S. story is one of near-stability in mean height coupled with widening internal disparities. While average stature has not shifted dramatically, obesity trends and differential access to healthful diets complicate public-health assessments of adolescent growth.
US male height trends
Implications for Health, Policy, and Society
Why should policymakers and the public care about shifts in mean height? First, height is linked to important adult outcomes: taller populations tend to have lower rates of certain diseases and higher average earnings — relationships that reflect underlying early-life conditions rather than height per se. Second, stagnation or decline in heights can be an early warning sign of deteriorating childhood conditions or widening inequality. Finally, tracking stature offers a cost-effective complement to other public-health indicators and helps target interventions where they are most needed.
- Simple, measurable indicator of long-term childhood health.
- Reflects cumulative effects of nutrition, sanitation, and healthcare.
- Masking of inequality: averages hide variance within populations.
- Slow-moving: height responds over decades, not months.
Limitations and Cautions
Any cross-national comparison faces several caveats. Measurement protocols vary across surveys and decades; sample composition (urban vs. rural, socioeconomic mix) influences means; and migration can alter national averages. Importantly, genetic differences exist but cannot explain rapid changes within a few decades — those are overwhelmingly environmental. Thus, while the approximate numbers used here are useful for discussion, precise policy responses require local, high-quality data.
Conclusion: Reading Height as a Mirror of Progress
Between 1985 and 2019, many countries recorded gains in the mean height of 19-year-old males, but the size and timing of those gains varied widely. Northern European countries added modest increments to already-high baselines. East Asian nations registered dramatic increases as they modernized. Several lower-income countries made important but uneven progress, while others saw frustrating stagnation. Taken together, these patterns reinforce a central lesson: improvements in childhood environments — from maternal health and infant feeding to clean water and disease control — translate into tangible biological benefits across generations.
- Mean height at age 19 is a robust, long-term indicator of population health and childhood conditions.
- From 1985 to 2019, gains were largest in rapidly developing East Asian countries and smaller in already-tall Northern European countries.
- Persistent stagnation in some regions highlights the need for targeted investments in maternal and child health, sanitation, and nutrition.
A Final Thought
Height may be measured in centimeters, but its significance is measured in opportunity: the chance for a healthy childhood, the capacity to learn and work, and the social conditions that allow populations to flourish. Tracking stature through time is neither glamorous nor controversial; it is essential. When young people stop growing as expected, societies should ask why — and act accordingly.