Historic Precious Metals Plunge: Silver -38%, Gold -16%
The shock of a single trading day that erased a major piece of precious metals value will reverberate through markets, portfolios, and policy conversations for months. Silver fell roughly 38 percent from its recent record high and gold declined about 16 percent in what market participants are already calling the largest single-day percentage drop for these benchmark metals. This feature traces the immediate market reaction, the mechanics behind the sell-off, the historical context, and practical takeaways for investors who hold—or are considering—exposure to bullion, mining equities, and related instruments.
Silver price crash chart
WHAT HAPPENED: THE PRICE MOVE AND MARKET RESPONSE
The market opened with thin liquidity and quickly cascaded into a rapid sell cycle. Prices moved from calm to chaotic as stop orders executed, margin calls intensified, and certain leveraged products amplified flows. Within hours the metal benchmarks hit their intraday lows, exchanges temporarily adjusted trading parameters to arrest disorderly conditions, and commentators debated whether the move was driven by fundamentals, technical unwinds, or a mix of forced selling and sentiment shift.
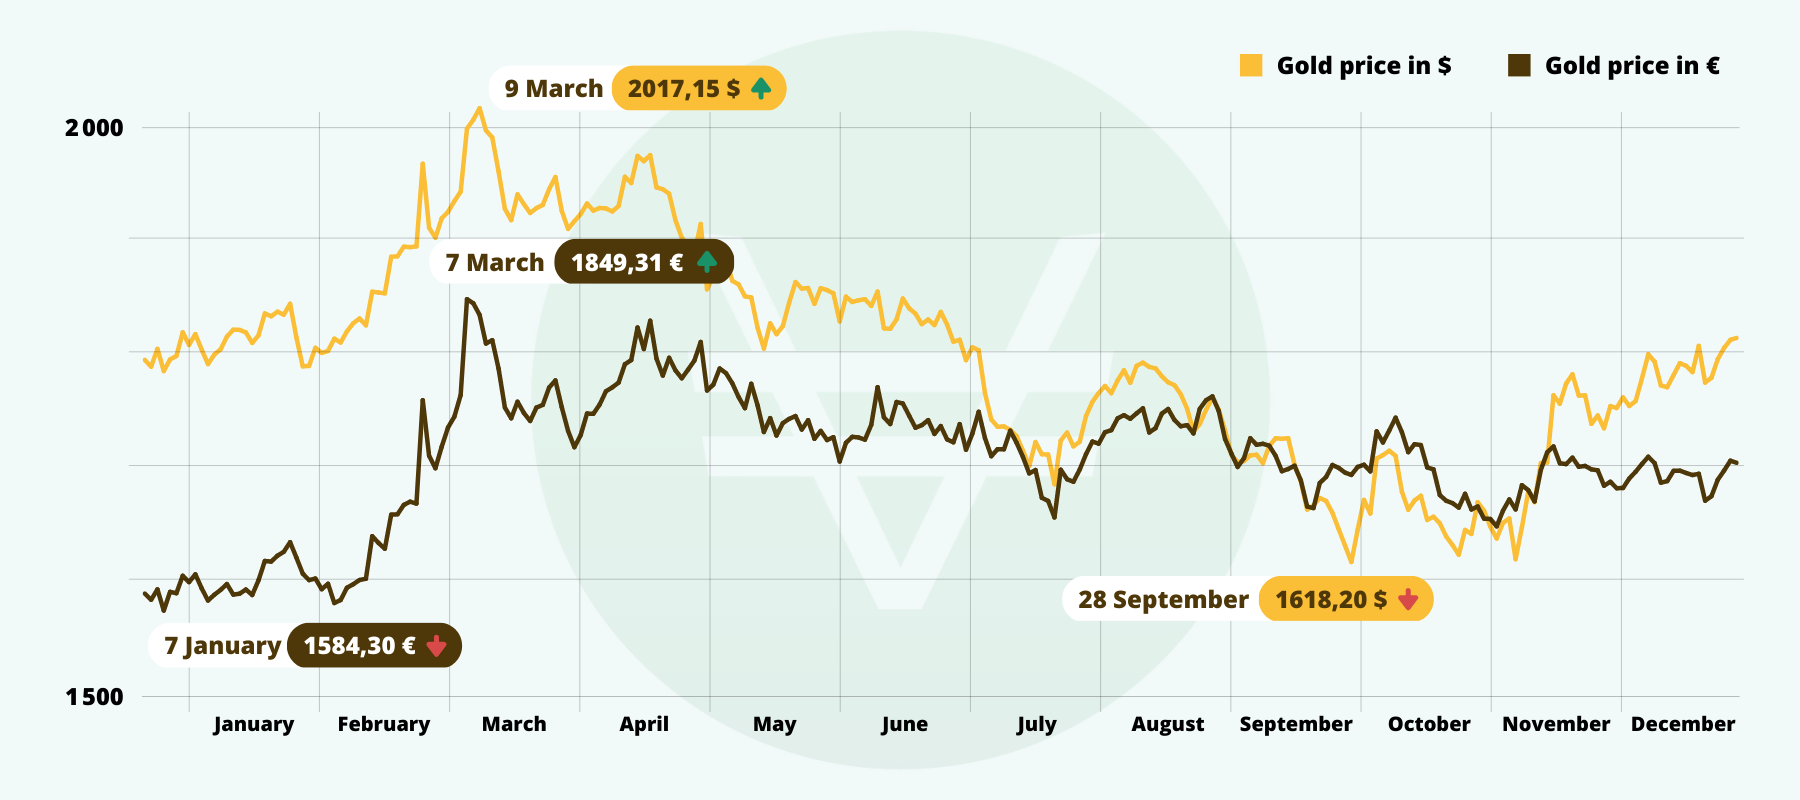
Gold drop market graph
Intraday dynamics
Three mechanics accelerated the plunge: abrupt liquidation of leveraged positions, concentrated sell orders in electronic venues, and a rapid widening of bid-ask spreads as market makers stepped back. When liquidity evaporates, even moderate sell pressure can cause outsized moves because there are not enough buy orders at successive price levels. That is what happened: each accelerated price drop in turn triggered more automated orders, creating a cascade.

Precious metals futures trading
"When liquidity disappears, price becomes a function of the next available buyer, not intrinsic value."
Exchange and clearing impact
Clearinghouses and futures exchanges monitor margin and position limits closely. In a violent move, margins are raised and some participants receive calls they cannot immediately meet. Forced liquidation at the worst prices is a predictable consequence. Market infrastructure interventions—short extensions, temporary halts, or tick-size changes—aim to restore order, but they can also concentrate selling into tight windows.
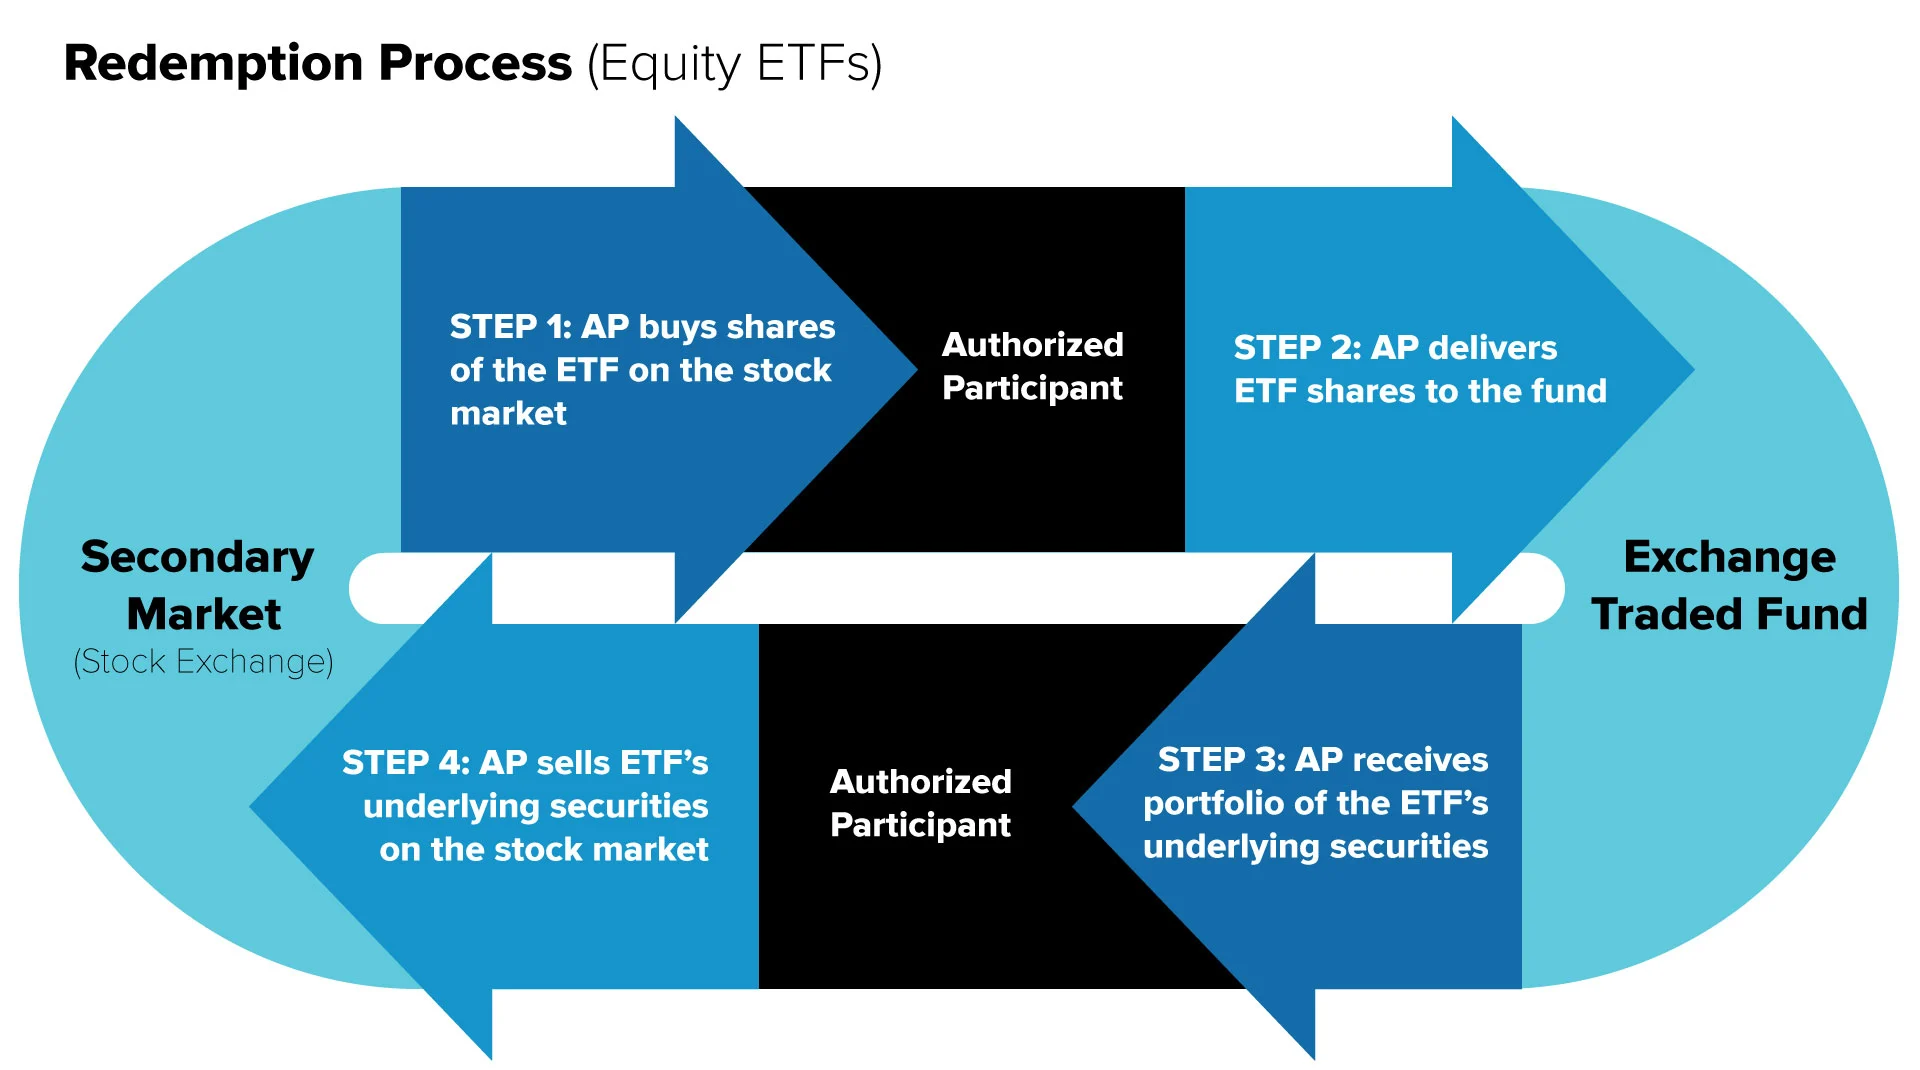
ETF redemption pressure
WHY IT HAPPENED: DRIVERS AND TRIGGERS
There is rarely a single cause for a historic market drop. Here the drivers combined macroeconomic shifts, technical vulnerabilities, and structural market features to produce a one-two punch.
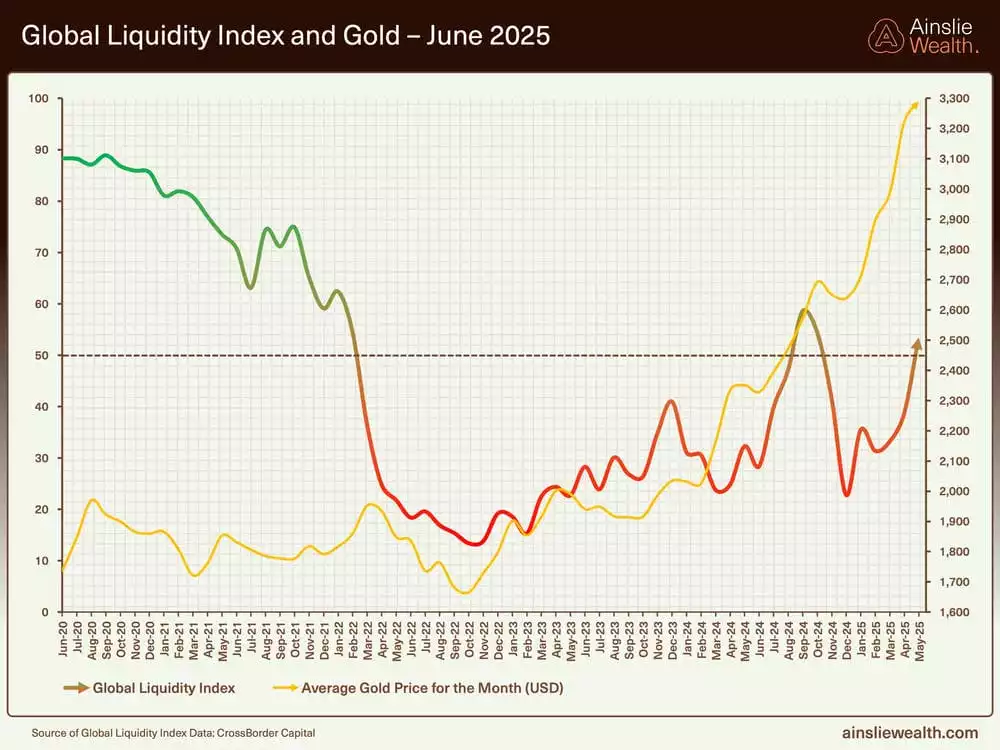
1. Macro backdrop: rates and the dollar
Precious metals are sensitive to real interest rates and the U.S. dollar. A sudden re-pricing of expected policy path—where central bank language or surprise economic data pushed real yields higher and the dollar stronger—reduces the opportunity cost of holding cash versus non-yielding metals. That headwind can quickly prompt margin-intensive investors to reduce exposure, especially when leveraged.
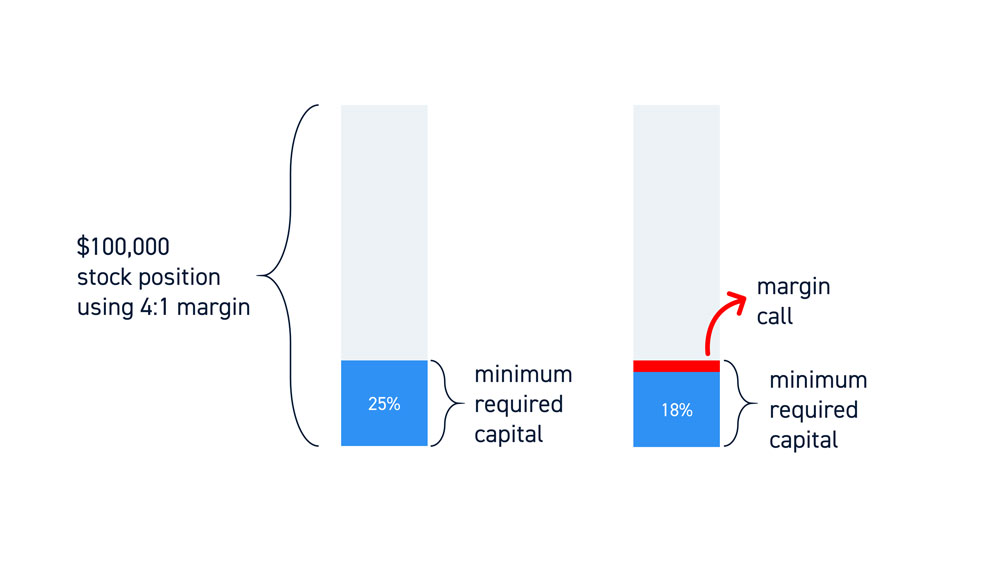
Leveraged position margin call
2. Leveraged long positions and speculative concentration
Markets that have seen outsized rallies often attract speculative, leveraged capital. Silver, with higher historical volatility and a smaller market than gold, becomes particularly vulnerable when speculative positioning concentrates on the long side. When the rally stalled, margin pressure from leveraged funds and retail investors amplified the downward spiral.
Silver gold liquidity panic
3. Technicals and algorithmic trading
Technical catalysts—key moving averages, break of trendlines, or a cluster of stop-loss orders—can act like accelerants. Algorithmic and high-frequency strategies that detect momentum and exploit microstructure dislocations may have contributed to a rapid price discovery that overshot fair value in the short run.
COMEX trading halt
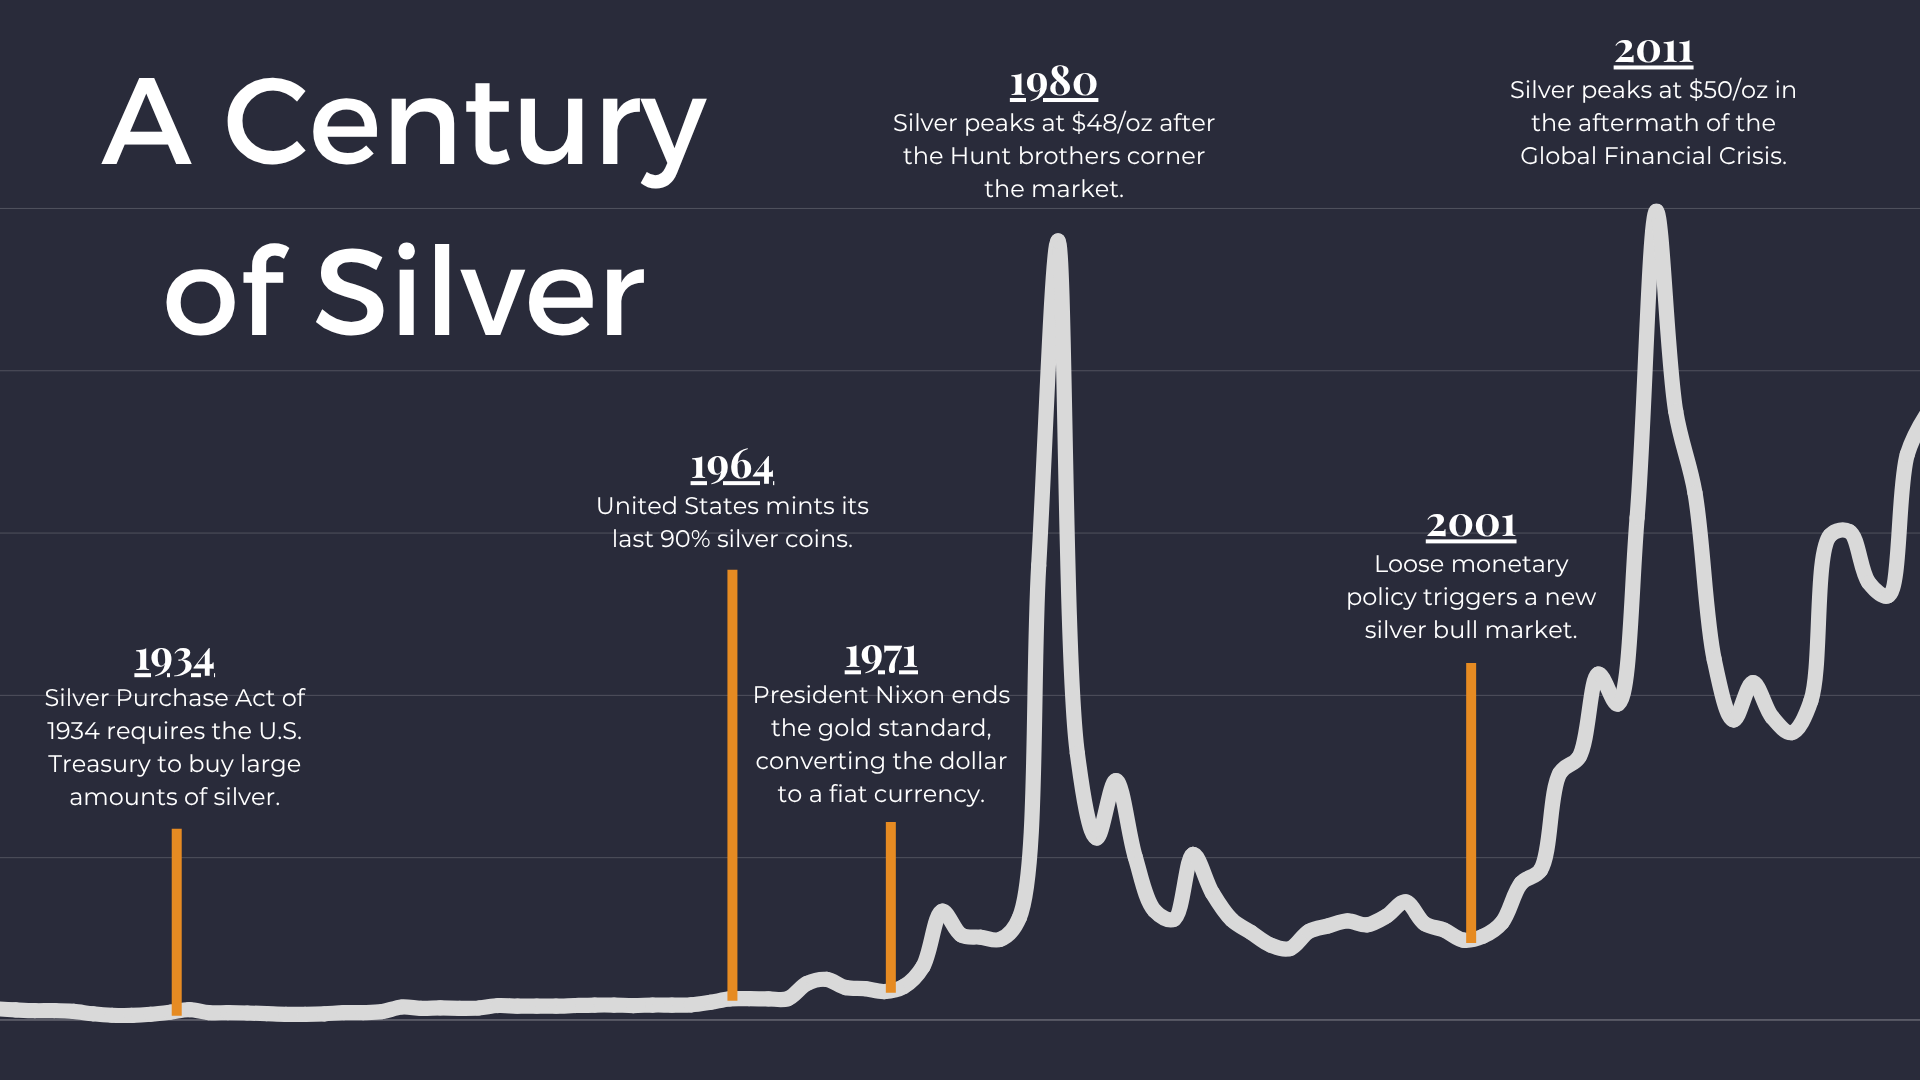
HISTORICAL CONTEXT: HOW RARE IS THIS?
Large moves are part of commodity markets, but a 38 percent downward swing from a record high in silver and a 16 percent fall in gold on the same day is extraordinary. In scale, this event sits alongside high-profile commodity collapses of previous decades, though each episode has unique drivers. Silver’s smaller market capitalization relative to gold and its dual role as an industrial metal and monetary asset make it more susceptible to violent reversals.
Comparative episodes
History offers instructive parallels. Silver has displayed sharp corrections after speculative peaks before, and gold has had episodic declines driven by rate shocks or liquidity squeezes. Yet few events combine such synchronized, large percentage drops across both metals in a single trading day. Investors should treat this as a reminder: extreme rallies often carry latent asymmetric downside risk.
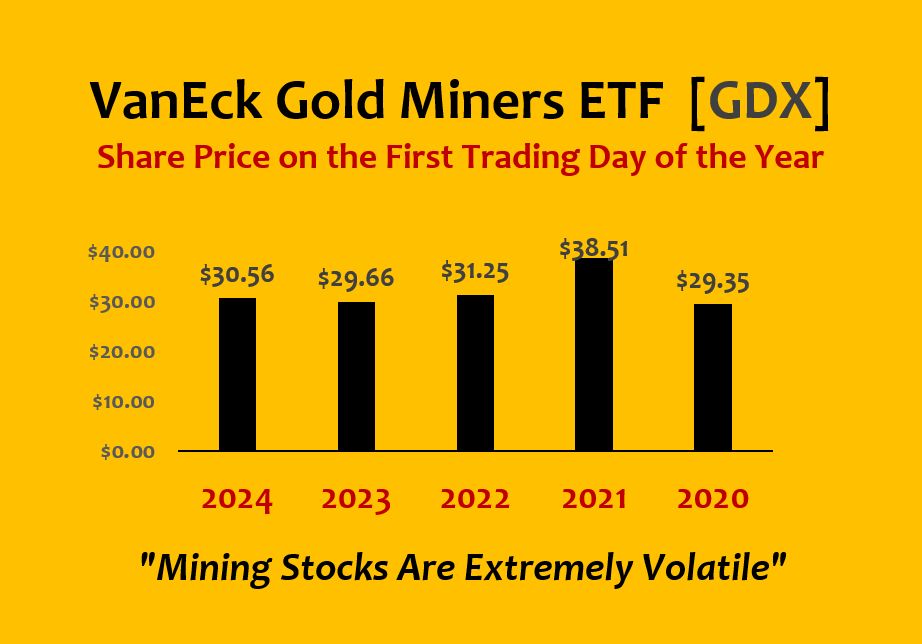
Mining stocks volatility
MARKET MECHANICS: FUTURES, ETFs, AND PHYSICAL FLOWS
Understanding how different instruments transmit stress helps explain why prices moved so far so fast.
Futures and margin interactions
Futures markets allow traders to take amplified positions with relatively small cash outlays. Margining daily gains and losses means that a single adverse day can consume collateral and force position reduction. When many participants are on the same side, the margin mechanism is a powerful multiplier for price moves.
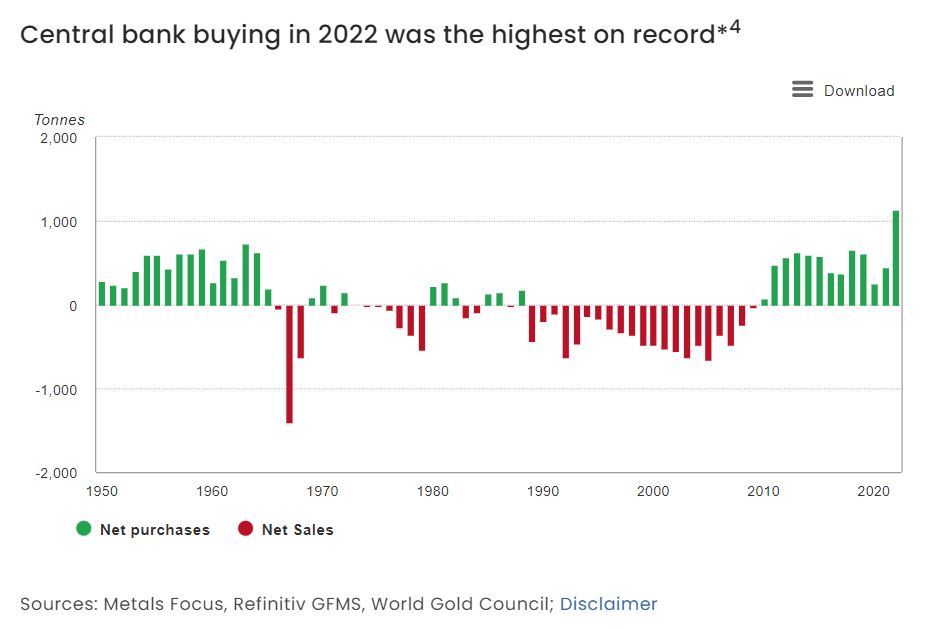
Central bank rates metals
ETFs and creation/redemption pressure
Spot-price-tracking ETFs manage flows through creation and redemption. If large investors redeem shares or arbitrageurs cannot find the basis to create new shares profitably, ETF managers may sell physical or futures to meet redemptions, adding to market pressure. Conversely, when inflows had been strong on the way up, the unwind can be particularly abrupt.
Technical analysis sell-off
IMPLICATIONS FOR INVESTORS AND PORTFOLIO STRATEGY
This section translates market mechanics into concrete investor consequences and practical steps.
Re-examining position sizing and leverage
One clear message: leverage magnifies both gains and losses. Investors who used margin or leveraged products experienced outsized drawdowns. Prudent position sizing and explicit stop-loss planning are essential in markets that can flip from calm to chaotic in hours.
Safe haven assets panic
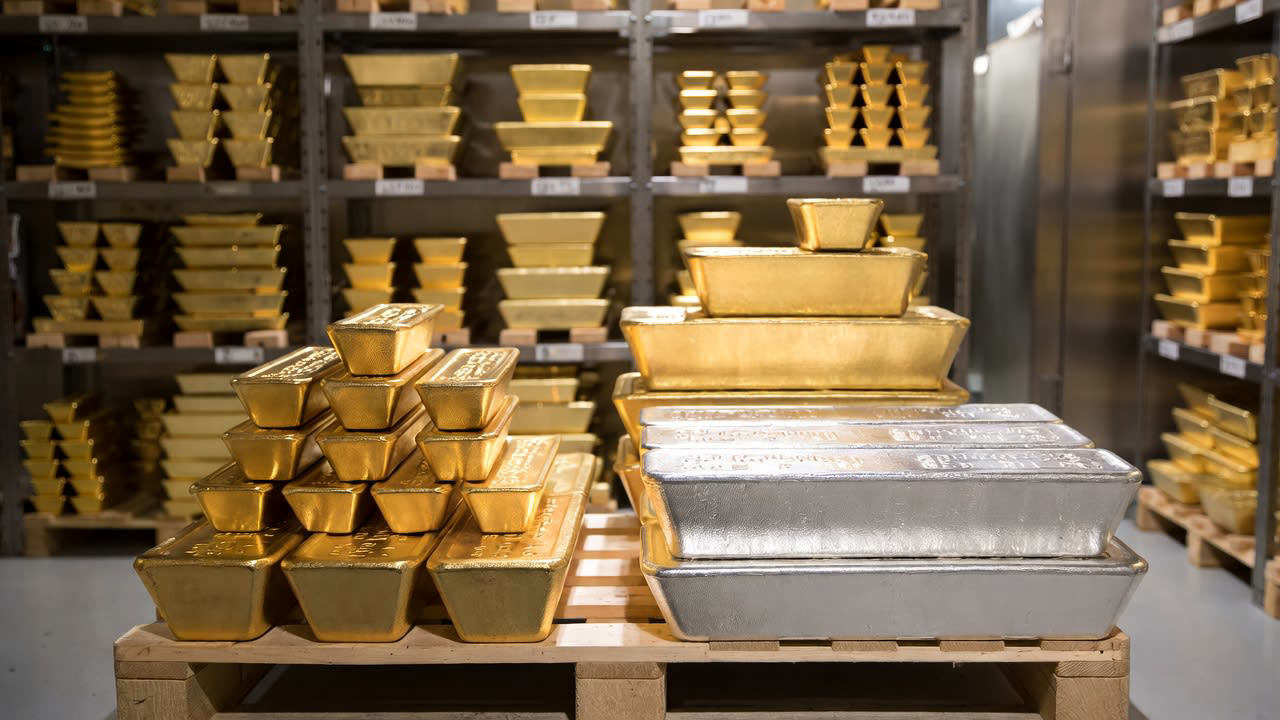
Liquidity planning and exit strategy
Illiquidity is the enemy of orderly exits. If you hold physical bullion, liquidity is typically better than thin futures markets at extremes; but trusted dealers may widen spreads. For ETF and futures holders, pre-defined exit rules and awareness of potential slippage help avoid being the marginal seller in a panic.
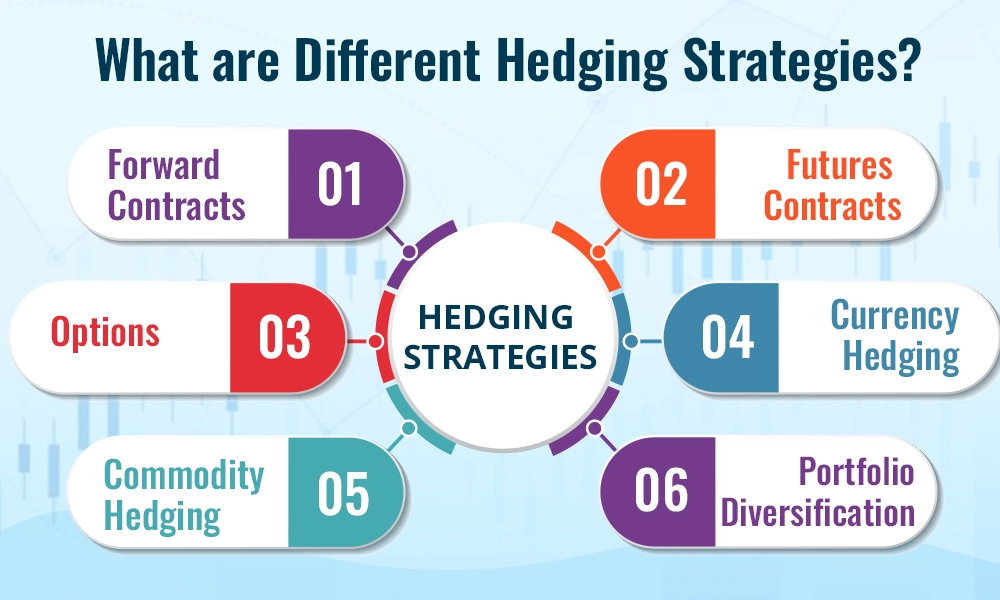
Investor strategy hedging
A FRAMEWORK FOR DECISION-MAKING
Responding rationally requires separating noise from signal. Ask three questions before acting: 1) Has the fundamental case changed? 2) Are you using leverage or instruments sensitive to margin and liquidity? 3) What is your time horizon and rebalancing capacity? If fundamentals unchanged and time horizon long, a disciplined approach often means buying opportunity; if your plan depended on short-term gains, cutting risk may be prudent.
REGULATORY AND MARKET STRUCTURE CONSIDERATIONS
Extreme events prompt regulatory scrutiny and often lead to after-action reviews by exchange operators and oversight bodies. Participants will want clarity on whether market structure contributed, whether tick sizes and margin models are appropriate for current volumes, and whether any trading venue had operational issues that exacerbated the move.
Potential changes to watch
- Margin model revisions: Exchanges may adjust intraday margin calculations to better reflect tail risks.
- Liquidity provisions: Market makers could face new incentives or requirements to provide continuous quotes during stress.
- Product disclosures: Issuers of leveraged and inverse products might increase transparency around concentration and liquidity risk.
PRACTICAL NEXT STEPS FOR DIFFERENT INVESTORS
Actions vary by exposure and investor type. Below are tailored suggestions rather than prescriptive advice.
Retail investors
Consider pausing automatic additions to leveraged or speculative positions until volatility normalizes. Review cost basis, tax implications of realized losses, and whether physical holdings or high-quality ETFs better fit your risk tolerance.
Institutional and wealth managers
Stress-test portfolios for liquidity and funding strain. Reassess counterparty exposures in derivatives and re-evaluate hedging strategies designed for calm markets when stress is high.
RISK-REWARD: OPPORTUNITY OR TRAP?
Volatility creates both risk and opportunity. For long-term holders who believe in metals as an inflation hedge or diversification tool, a sizeable pullback can be an attractive entry. For momentum and short-term traders, the event is a reminder that stop-losses, position limits, and robust trading infrastructure are essential.
"Big moves expose structural weaknesses. They also create fertile ground for disciplined, long-term buyers."
CONCLUSION
The dramatic one-day declines in silver and gold are a stark demonstration of how macro signals, market structure, and concentrated positioning interact to produce outsized moves. Whether the plunge proves to be a deep but short-lived correction or the start of a longer trend will depend on the evolution of monetary policy, real interest rates, dollar strength, and industrial demand for silver. For investors the lesson is clear: manage leverage, plan for liquidity stress, and align exposures with your time horizon.
- Silver and gold suffered historic, synchronized declines driven by liquidity withdrawal, margin pressure, and macro shifts.
- Leverage and concentrated positioning magnified the move; futures and ETFs transmitted stress quickly.
- Investors should re-evaluate position sizing, liquidity plans, and the fundamental case before making reactive trades.
Market conditions are fluid. This article explains mechanics and strategy concepts; it is not investment advice.