From 6,000 to 1.5M: Mapping Every Connection in the Epstein Files
The project began as a narrow curiosity: a cache of roughly 6,000 documents that seemed to describe a small, closed world of meetings, phone numbers, flight logs, invoices and shorthand references. What it became — after two years of ingestion, enrichment, algorithmic linking and human review — was an expansive, messy, and illuminating graph containing roughly 1.5 million discrete entities and relationships. The transformation was not just numerical. It changed how we ask questions about influence, how we weigh provenance, and how an investigative dataset can morph under the pressure of scale.
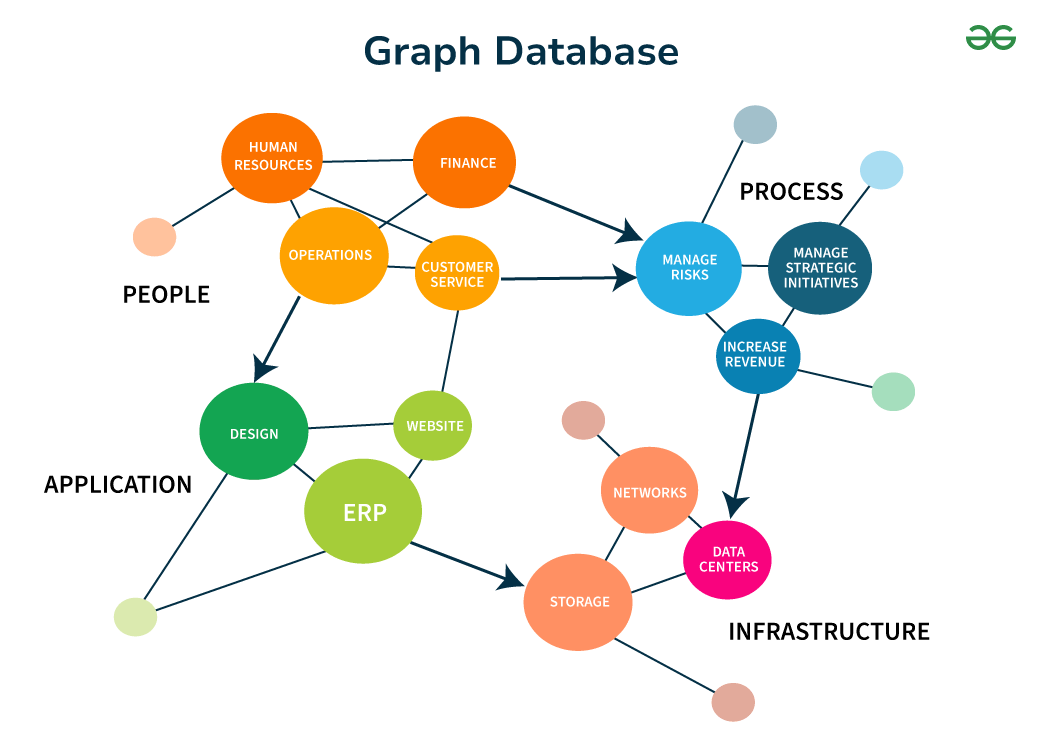
Graph database Neo4j
Why scale matters
At first glance quantity feels like a victory: more documents mean more facts, more cross-checks, more leads. But the quality of a dataset does not scale linearly with size. Every added document introduces noise: transcription errors, duplicate records, shorthand nicknames, redactions, and deliberate obfuscations. The jump from 6,000 to 1.5 million was not a constant-rate accumulation of clear, independent facts. It was a multiplication of entities and edges driven by a set of decisions — both technical and editorial — about what to extract, how to normalize it, and how to connect it.
How the corpus grew
There were four dominant vectors that converted a modest corpus into a sprawling network.
- Extraction and OCR expansion: Scanned PDFs and photocopies were processed with improved OCR, which surfaced thousands of previously hidden names and numbers. Each new token could become a node when matched to people, companies, phone numbers or properties.
- Metadata harvesting: When metadata fields (dates, authors, file paths, hashes) were normalized and treated as first-class entities, they connected documents across time and storage locations and multiplied the graph.
- Cross-linking with external registries: We resolved corporate registries, aircraft registries, property databases and public court records against the document text. A single company name in a flight manifest could now link to corporate officers, addresses and subsequent filings.
- Automated entity disambiguation: Algorithms that attempt to determine whether two mentions refer to the same person can be conservative or aggressive. Moving the threshold even slightly creates exponential link growth: groupings of previously separate mentions collapse into single entities, while permissive linking expands reach through inferred associations.
When you change how strictly you say two names are the same, you don’t add a few connections — you multiply the graph.
The pipeline: from raw file to living graph
The pipeline followed a layered approach: ingest, extract, normalize, link, enrich and review. Each stage added both clarity and complexity.
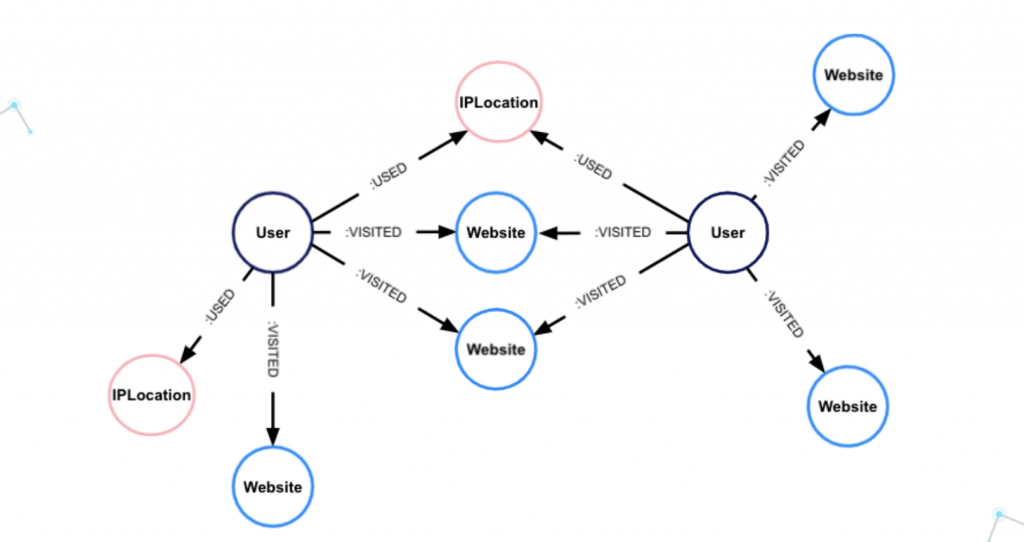
Entity resolution graph
Ingest and preprocessing
Files arrived in many formats: PDFs, TIFFs, Word documents, spreadsheets, email exports. The first step was uniforming byte-level differences: computing content hashes, preserving file timestamps where available, and capturing file provenance. Where optical character recognition (OCR) was needed we used multiple engines and consensus verification to reduce transcription errors. This duplicated some work — the same text might be represented in three OCR passes — but it dramatically reduced false negatives in entity extraction.
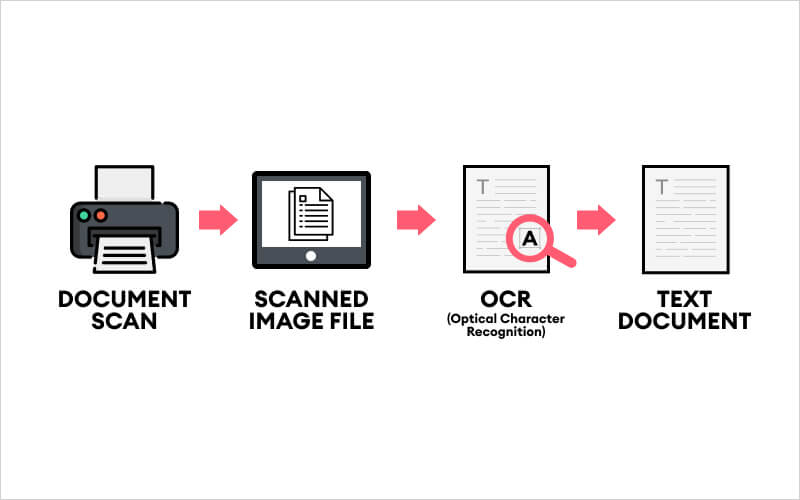
OCR document processing
Extraction and entity recognition
Next we ran named-entity recognition (NER) to find names, places, dates, company names, phone numbers and other structured tokens. Early iterations missed shorthand references and initialisms; later models were retrained on the corpus to improve recall. Each recognized token became a candidate node, and every co-occurrence within a document created an edge. That simple decision — treat co-occurrence as relation — led to a very dense initial graph that required careful pruning.
Normalization and canonicalization
People appear in documents as full names, initials, nicknames, or titles. Companies use subsidiaries, abbreviations, or former names. A crucial step was canonicalization: choosing a canonical label for each real-world entity. This relied on record linkage techniques combining string similarity, contextual overlap and external identifiers. We created canonical records only when evidence passed a scoring threshold. That threshold setting was a tipping point for scale: low thresholds merged more mentions (reducing node count but increasing edge weight); high thresholds left many duplicates (increasing node count and fragmentation).
Linking and enrichment
Once canonicalized, entities were enriched with auxiliary data: corporate IDs, aircraft tail numbers, property parcel IDs, phone-carrier records where legally obtainable, and court case metadata. Every enrichment added nodes and edges: a company node connected to its officers, to addresses, to filings. This web of linkages is where the raw document corpus acquired dimensionality — where a simple invoice could lead to a shell company that connected to a registered address and from there to multiple property holdings.
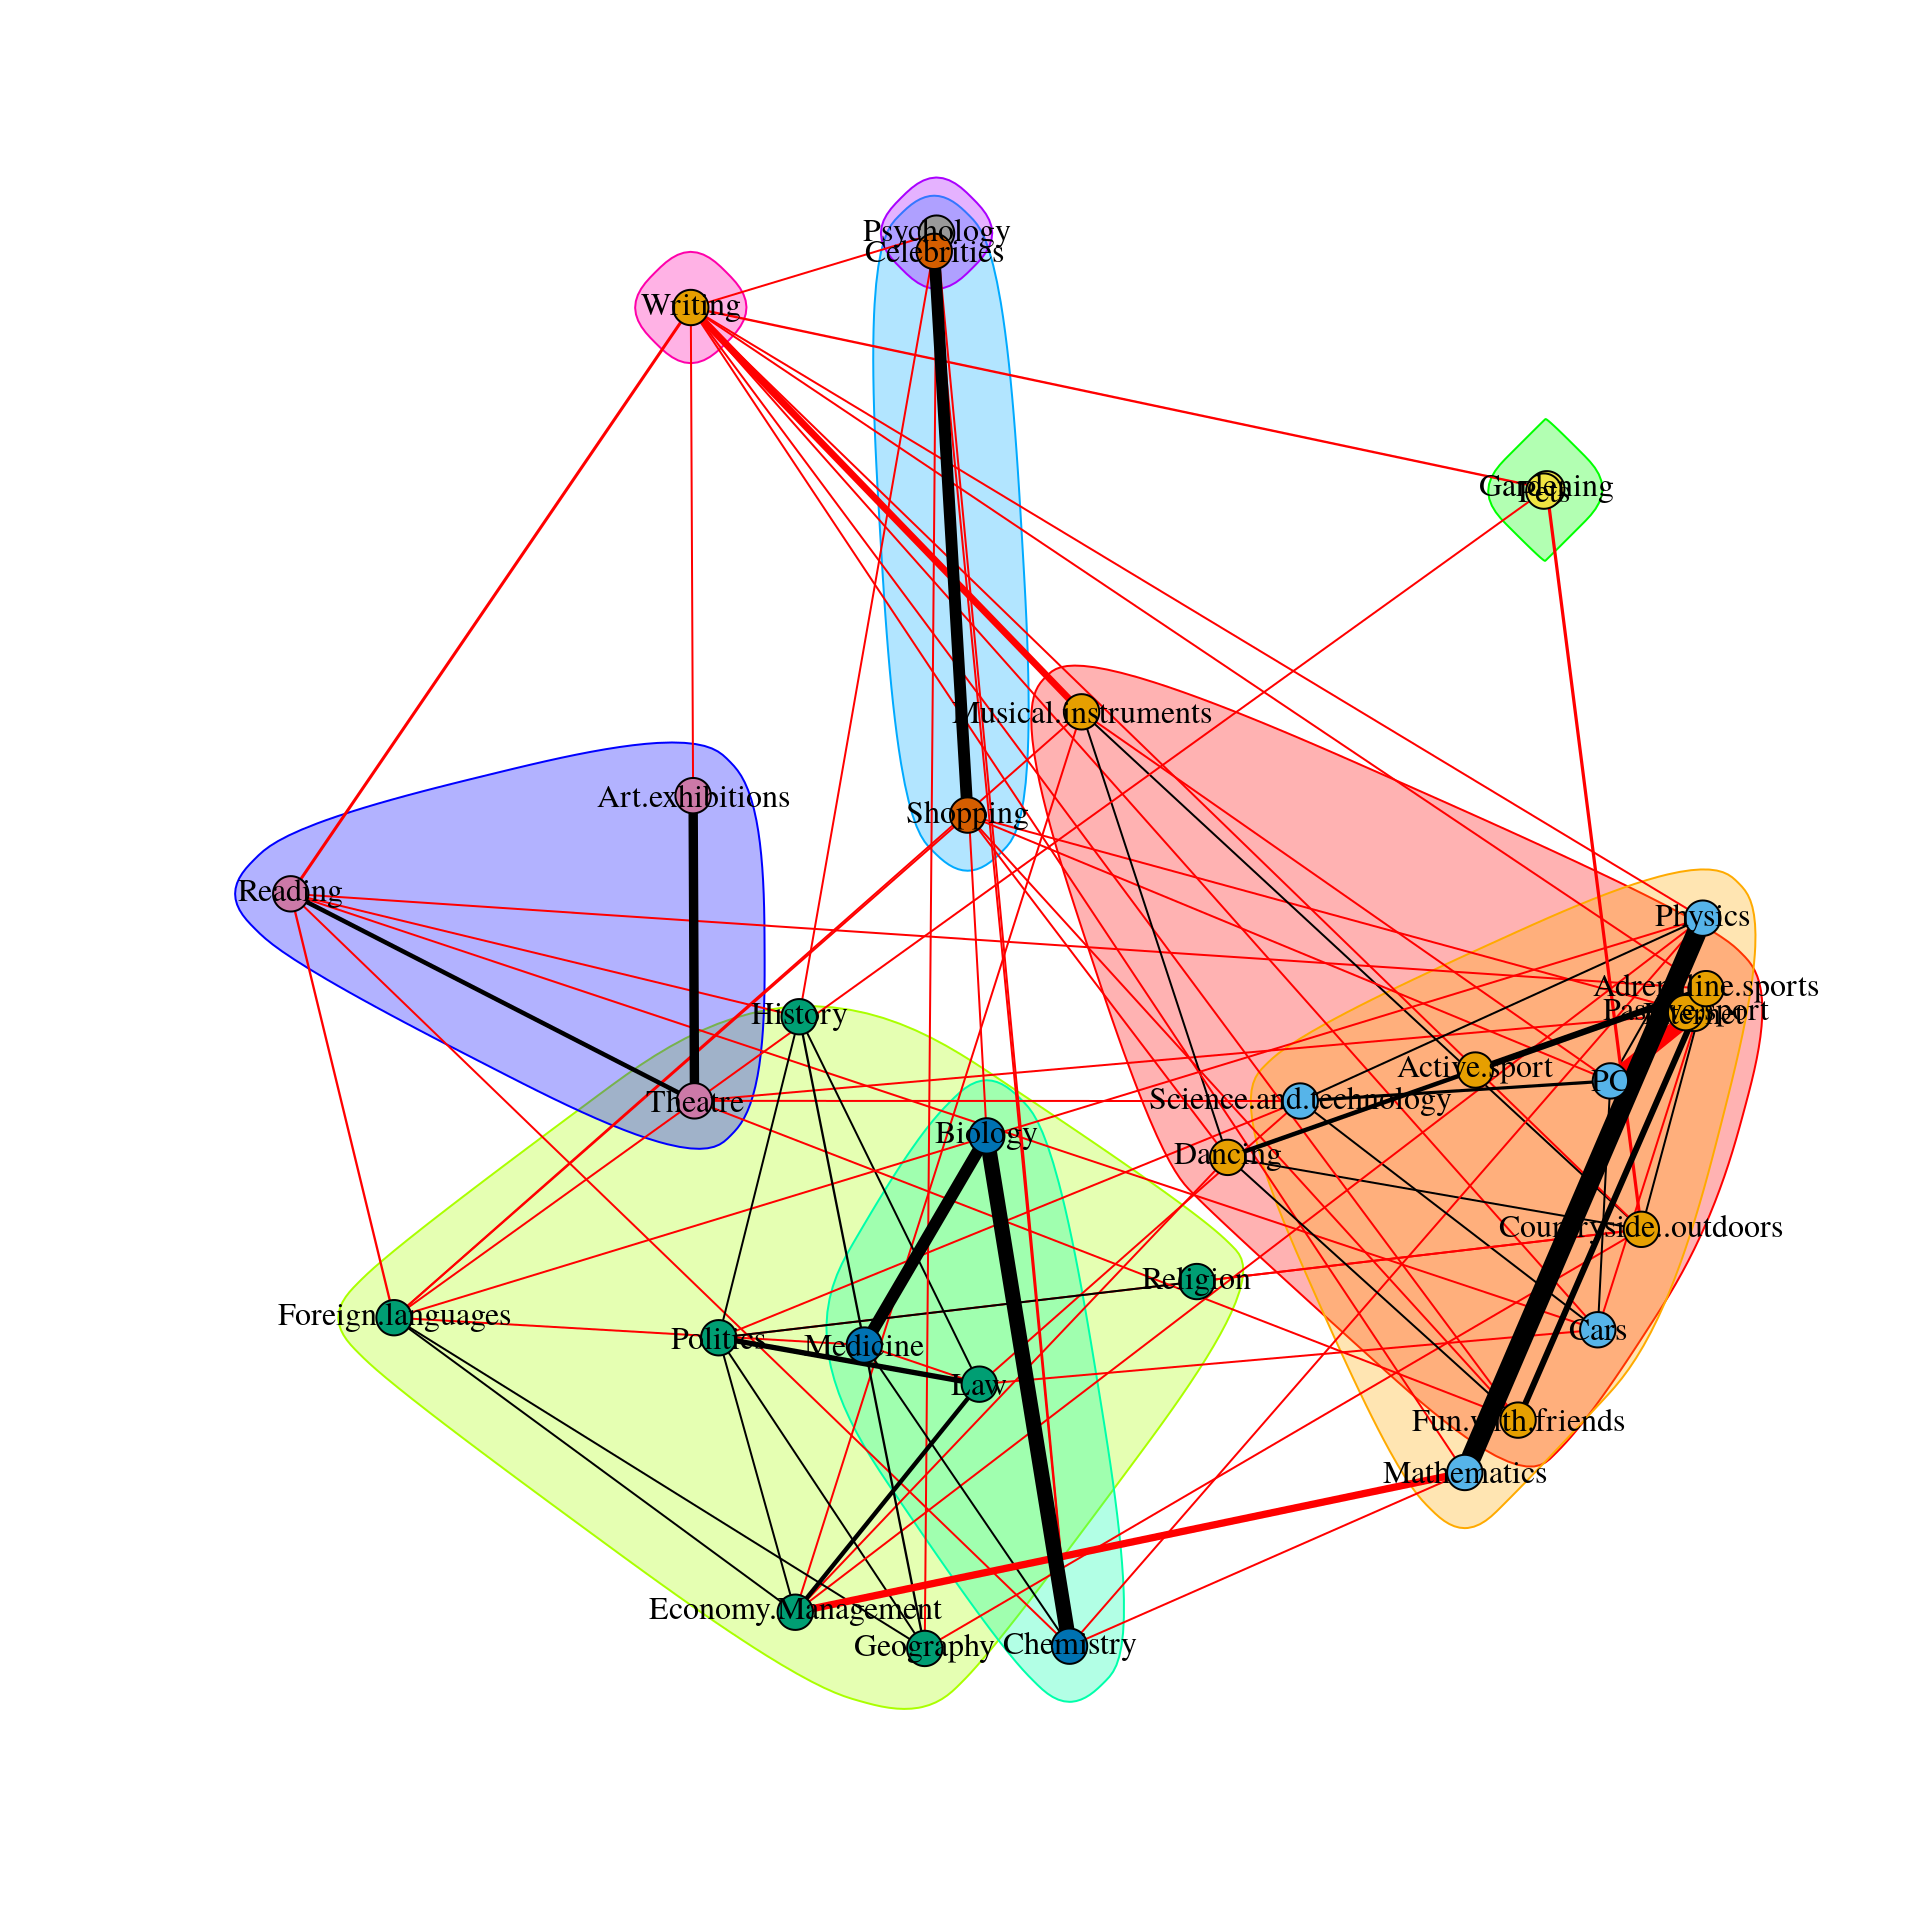
Network analysis graph
Verification and human review
No amount of automation solves context. We built an interface for reviewers to inspect proposed merges, to flag false positives and to add provenance notes. Human-in-the-loop validation was vital but slow; reviewers became the gating factor for releasing new merges into the public-facing graph.
Technical choices that shaped outcomes
Two technical decisions had outsize effects on the final map.
- Graph model vs relational model: Choosing a graph database made implicit relationships explicit and queryable. That design encouraged exploratory linking that would have been cumbersome in a tabular schema.
- Entity-first indexing: Treating extracted entities as primary indexes (rather than the document itself) incentivized enrichment and cross-referencing. The graph now centered on people, companies and events, not files — a conceptual shift that multiplied connections.
When growth becomes distortion
Every dataset has a fidelity budget: a limit to how much inferred structure you can add before you begin to misrepresent the underlying evidence. Two pitfalls emerged.
1) The false-friend problem
Names like "John Smith" or initials like "J.S." can appear dozens of times across unrelated files. Aggressive linking that equates identical strings risks collapsing distinct people into a single node. This results in apparent concentrations of influence that do not exist in the original documents.
2) Transitive overreach
If A is linked to B in document X, and B is linked to C in document Y, it is tempting to infer some relationship between A and C. But that transitive inference is legitimate only when there is shared context that justifies it. Blind transitivity can create chains of implication that read like evidence but are merely artifacts of overlapping mentions.
A chain of mentions is not a chain of intent.
Policies to protect fidelity and privacy
We implemented explicit rules: require independent corroboration to strengthen a link; treat redacted or ambiguous tokens as lower-confidence nodes; and never expose personally identifying information for individuals who are not public figures or who are clearly minors in the source material. Those policies slowed growth but preserved legal and ethical integrity.
Ethical and legal considerations
Mapping sensitive documents is not only a technical exercise — it's an ethical one. The project touched on private individuals, sealed judgments and material that may have been illegally disclosed. We balanced transparency with harm reduction by segregating non-public nodes, storing provenance, and creating an auditing trail for every asserted connection.
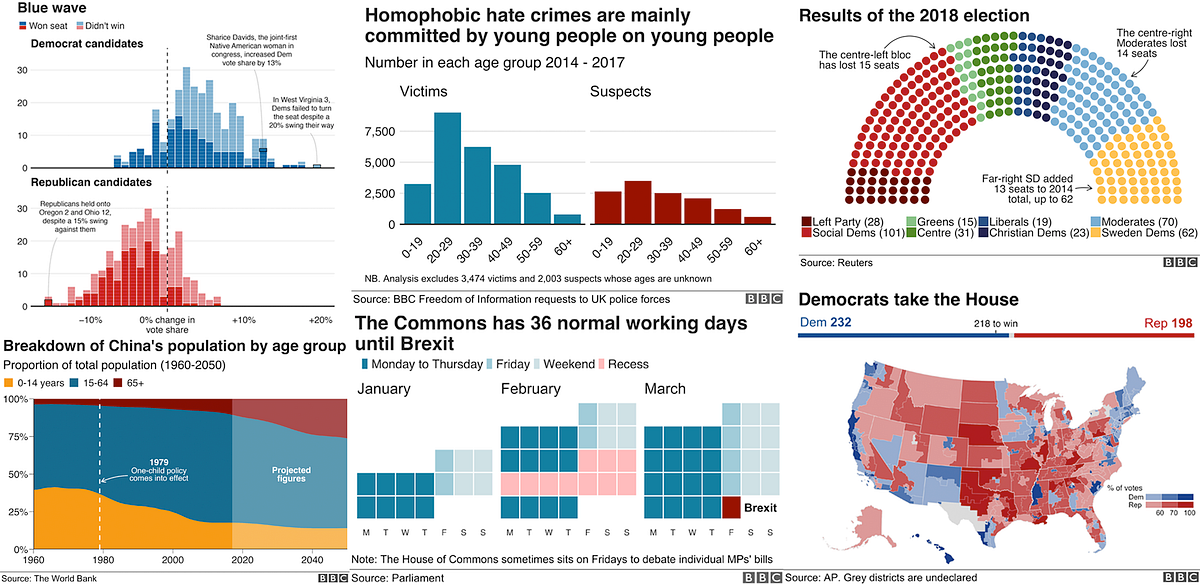
Data journalism visualization
Transparency mechanisms
Each node includes provenance metadata: file ID, excerpted snippet, page number, OCR confidence and reviewer notes. Where a connection was built from multiple documents, the interface shows a timeline and the strength score used to justify the merge.
Surprises that emerged during analysis
The size of the graph revealed patterns that were invisible at small scale.
- Hidden hubs: Small corporate shells, once noise, aggregated into structural hubs when enriched with registry data. These hubs linked disparate travel logs to the same registered address or nominee director.
- Temporal clustering: Events clustered not only by date but by lull-and-surge patterns consistent with seasonal activity — a nuance that suggested operational rhythms rather than one-off coincidences.
- Data lineage gaps: Many records referenced earlier documents that were not present in the corpus — notes like "see file" without the referenced file. Recognizing these gaps recalibrated confidence scores for affected links.
How to read the map responsibly
When you look at a node with many connections, ask: Are those connections documented directly, or are they inferred? Is the node a legal entity with public filings, or a text mention with high OCR uncertainty? We provide filters for confidence level, source type and whether human review confirmed the link.
Maps point. They do not convict.
Reproducibility and tools for other researchers
To help others replicate or interrogate our approach, we published (in accompanying technical notes) the high-level architecture: multi-engine OCR consolidation, NER models fine-tuned on the corpus, fuzzy matching thresholds used for canonicalization, and enrichment sources. We withheld raw personally identifying data where disclosure risk was high. The goal was to make the methodology auditable without unnecessarily amplifying harm.
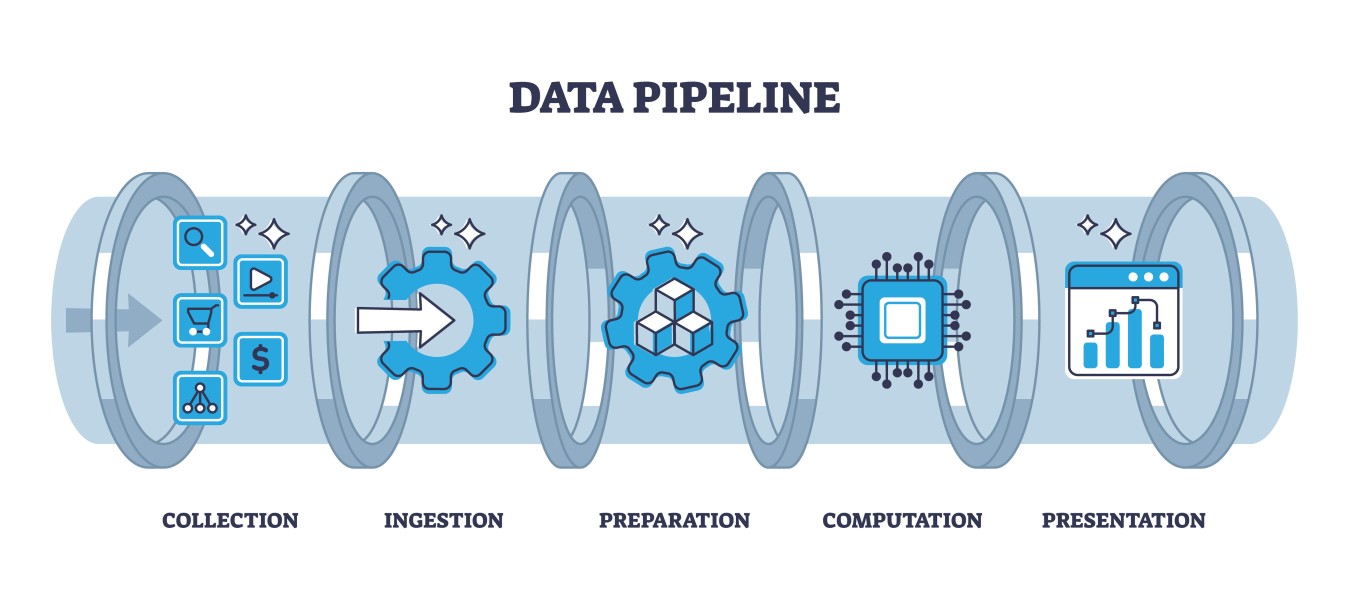
Data pipeline visualization
Lessons learned: technical and editorial
Several practical lessons surfaced.
- Version control matters: You must track every change to canonical records and keep the ability to rollback merges. A single mistaken merge can distort dozens of downstream inferences.
- Human attention is scarce: Use automation to triage, not to decide. Let machine confidence scores prioritize human review.
- Design for explainability: Every automated merge should come with a concise, machine-readable explanation of the signals that produced it.
Impact beyond the dataset
Tools and visualizations built for this project have broader utility. Law enforcement, academic researchers and other journalists can adopt the same pipeline for large-scale document analysis. But with power comes responsibility: the same methods that highlight potential wrongdoing can also amplify errors when misapplied.
A note on narrative framing
It's tempting to use a dense graph as a narrative shortcut: the denser the cluster, the more compelling the story. Resist that temptation. A dense cluster is interesting because it merits targeted investigation, not because it is an airtight conclusion. Readers and researchers should treat the map as an investigative aid, not a court.
What changed in public understanding
The map altered public conversations by turning scattered documents into interrogable structure. Patterns that once required months of manual cross-referencing became visible in minutes. That speed changed how leads were pursued: reporters could prioritize follow-ups with specific documents and matching external records rather than broad sweeps.
Closing the loop: verification and outcomes
Some leads generated by the map resulted in new reporting and public records checks that confirmed specific links; others dissolved under scrutiny. That mixture is the point. A healthy investigative ecosystem requires both the amplification of plausible leads and the humility to correct public claims when evidence does not hold up.
The value of a map is in what it makes visible — and what it compels us to verify.
Conclusion: scale as a lens, not an answer
Moving from 6,000 documents to a network of 1.5 million entities taught a simple but crucial lesson: scale amplifies both insight and error. Building large investigative graphs demands not only engineering skill but also editorial discipline and ethical clarity. The end product is most valuable when it is transparent about confidence, provenance and limits.
- Growth in data volume requires new norms for verification and provenance.
- Technical thresholds (like entity matching) are editorial choices with large consequences.
- Human review must be prioritized where legal or privacy risks exist.
- Maps are tools to surface leads, not to offer definitive judgments.
Final thought
The work of mapping connections in sensitive document sets is never finished. New documents surface, models improve, registries update and, most importantly, human understanding evolves. If we treat scale as a lens — one that needs polishing, calibration and constant interrogation — then a massive map can be less a spectacle and more a service to truth.